China’s Demographic Timebomb: Lessons from Japan’s Lost Decades
China is contending with a low birthrate and population aging similar to Japan with the added challenge of facing these headwinds before it becomes affluent. China can learn from Japan by raising productivity through structural reforms to sustain economic growth.
Like Japan before it, a declining birthrate and an aging population have precipitated a drop in the proportion of the working-age population and the savings rates in China, impacting long-term economic growth
In response, China needs to boost the supply of labor through relaxing birth restrictions and raising the retirement age
China also needs to enhance productivity by further promoting reform and opening up while capitalizing on the vitality of its private companies
China’s birthrate has been declining due to its one-child policy, while population aging is gathering pace as life expectancy lengthens. The resulting drop in the proportion of the working-age population has acted as a constraint on economic growth. While low birthrates and population aging are phenomena common to developed countries, with Japan being a leading example, China has to face this severe challenge before it becomes affluent. Japan’s efforts to encourage childbirth, extend the retirement age and promote women’s employment, and to boost demand through the implementation of expansionary fiscal and monetary policies have failed to lift its economy out of stagnation. The major lesson for China from Japan’s lost decades is that raising productivity through structural reforms is the key to sustaining economic growth.
Falling Birthrates and a Shrinking Population
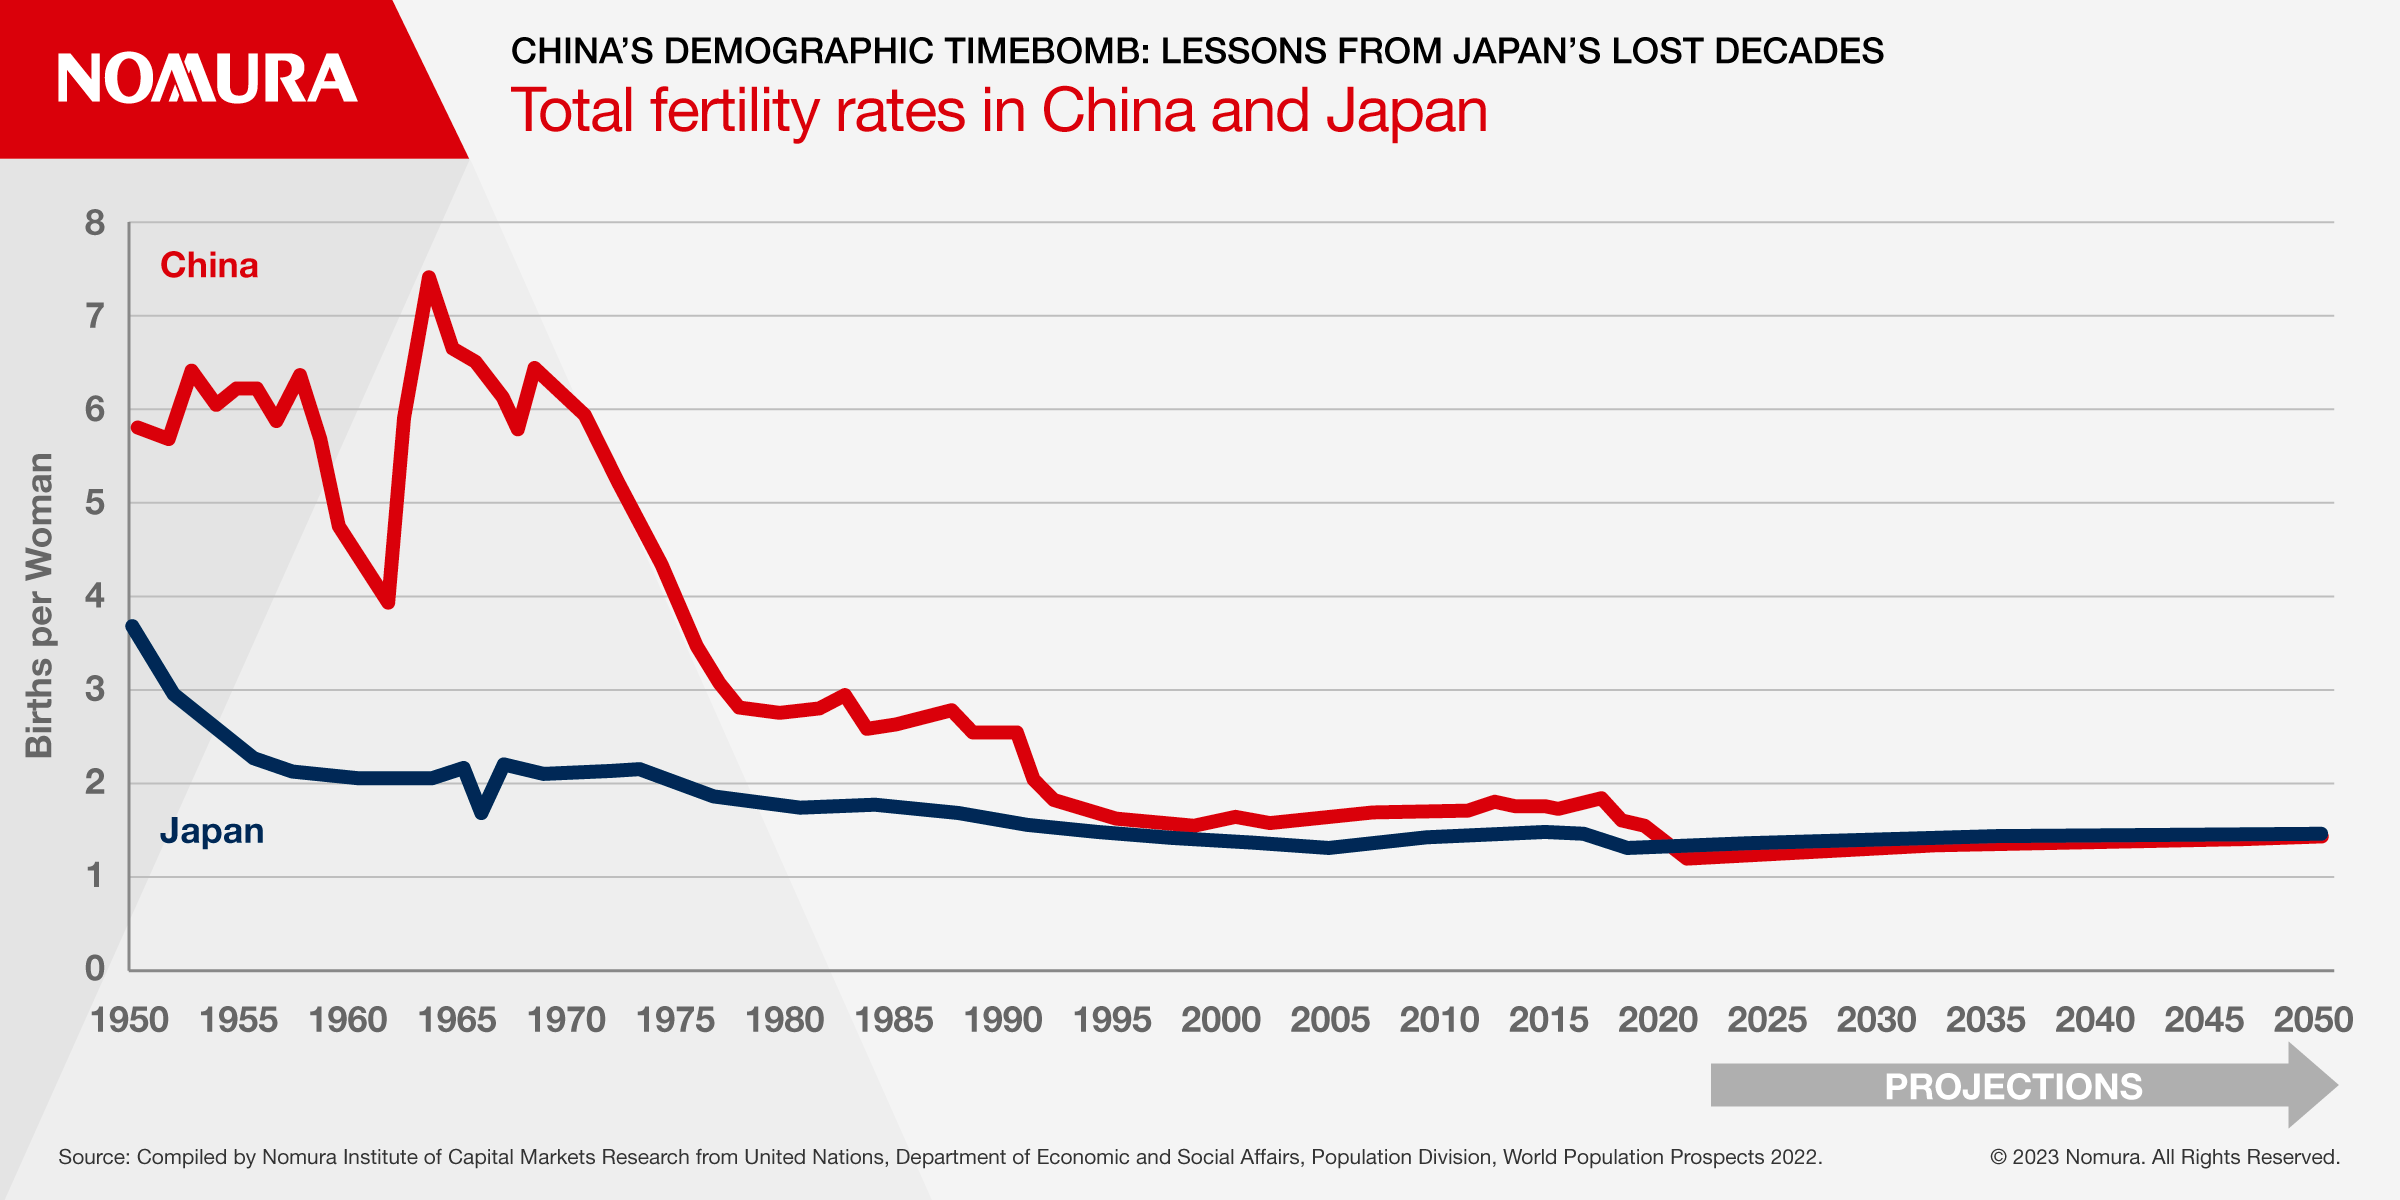
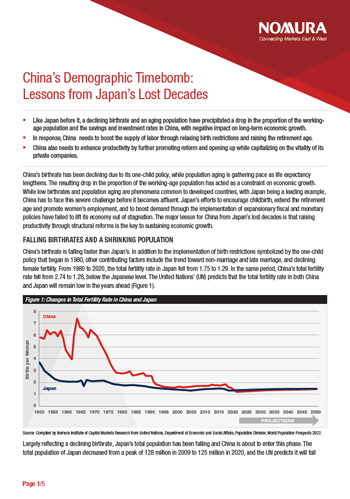
China’s birthrate is falling faster than Japan’s. In addition to the implementation of birth restrictions symbolized by the one-child policy that began in 1980, other contributing factors include the trend toward non-marriage and late marriage, and declining female fertility. From 1980 to 2020, the total fertility rate in Japan fell from 1.75 to 1.29. In the same period, China’s total fertility rate fell from 2.74 to 1.28, below the Japanese level. The United Nations’ (UN) predicts that the total fertility rate in both China and Japan will remain low in the years ahead (Figure 1).
Figure 1: Changes in Total Fertility Rate in China and Japan
Largely reflecting a declining birthrate, Japan’s total population has been falling and China is about to enter this phase. The total population of Japan decreased from a peak of 128 million in 2009 to 125 million in 2020, and the UN predicts it will fall to 104 million by 2050. Meanwhile, China’s total population increased from 982 million in 1980 to 1,425 million in 2020, and is predicted to decline from a peak of 1,426 million in 2021, to be overtaken by India in 2023, and to shrink to 1,313 million by 2050.
Change in The Age Structure
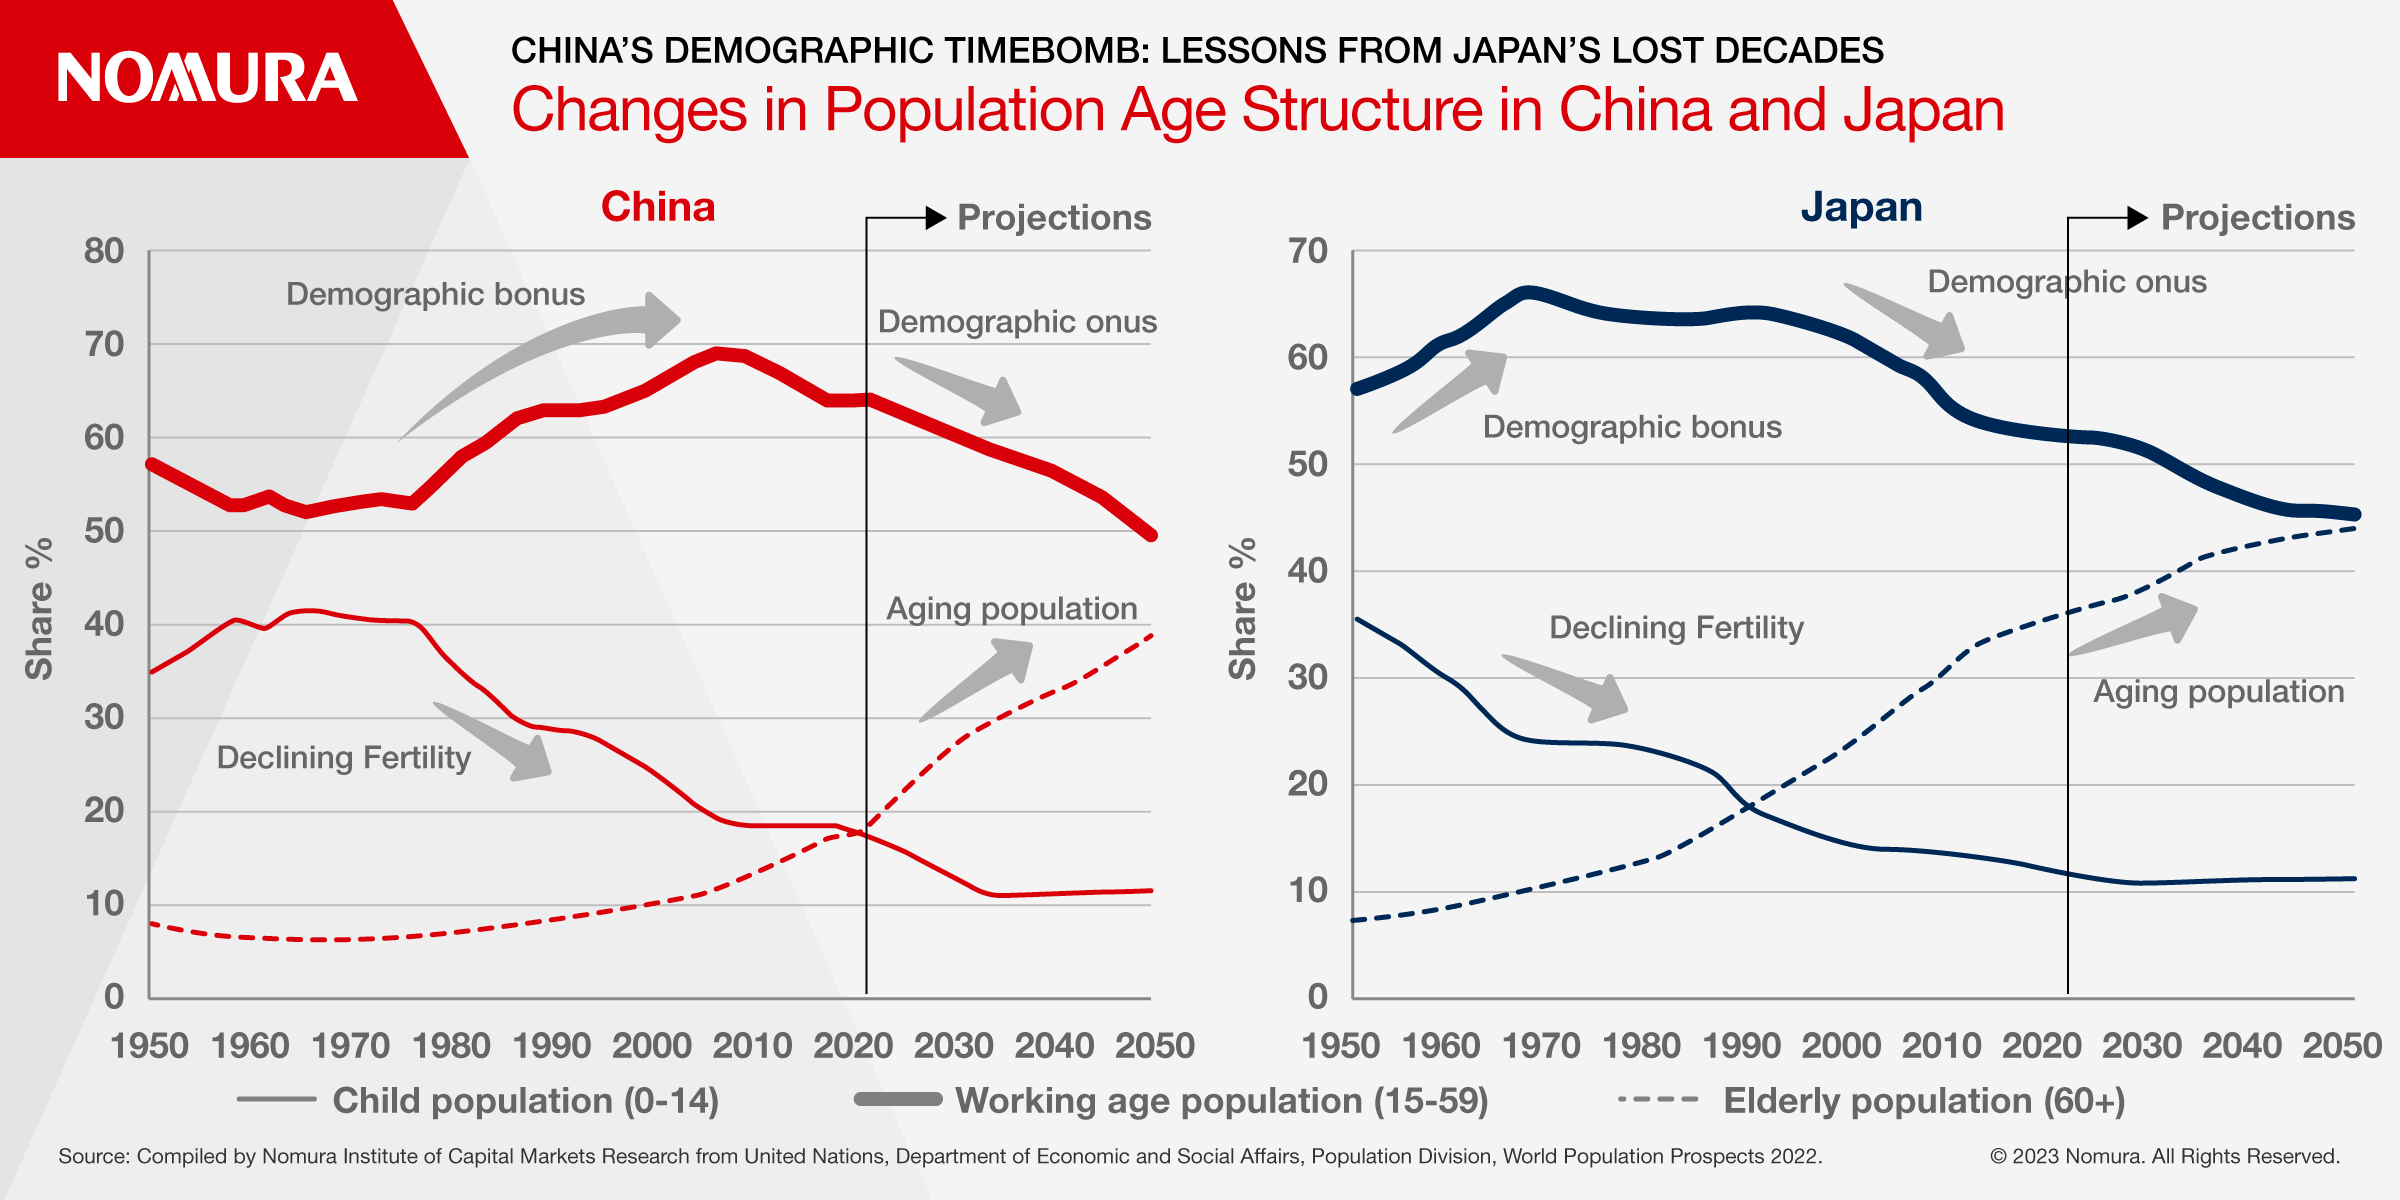
In both China and Japan, declining fertility rates have not only curbed population growth, but have also significantly changed the age structure of the population (Figure 2).
Looking at the three categories of the population: children aged 14 and under, the working-age population aged 15-59, and the elderly aged 60 and over, the proportion of the child population in Japan declined from 23.1% to 11.9% between 1980 and 2020, while the proportion of the elderly population surged from 13.1% to 35.4%. Reflecting the fact that the aging of the population is outpacing the decreasing child population resulting from low birthrates, the proportion of the “nonworking-age population,” has been rising. Conversely, the proportion of the working-age population, which peaked at 65.9% in 1968, declined further from 63.8% to 52.6% between 1980 and 2020.
Figure 2: Changes in Population Age Structure in China and Japan
In China, on the other hand, from 1980 to 2020, the proportion of the child population halved from 36.1% to 18.0%, while that of the elderly population rose from 6.9% to 17.8%. The proportion of the working-age population rose from 57.0% in 1980 to 69.2% in 2007 before dropping to 64.1% in 2020. This means that the demographic bonus that supported economic growth has turned into a demographic burden.
In 2020, the proportion of the child population and that of the elderly population in China were equivalent to their respective levels in Japan in 1990, and the proportion of the working-age population was equivalent to the 1989 level in Japan. Thus, the age structure of the population in China in 2020 was similar to that of Japan around 1990.
The low birthrate and aging population are expected to continue in both Japan and China in the future. According to United Nations (UN) projections, in 2050, the proportion of the child population in Japan will fall further to 11.1% and that of the working-age population to 45.2%, while the proportion of the elderly population will rise further to 43.7%. As for China, the proportion of the child population will fall further to 11.4% and that of the working-age population to 49.7%, while the proportion of the elderly population will rise to 38.8%.
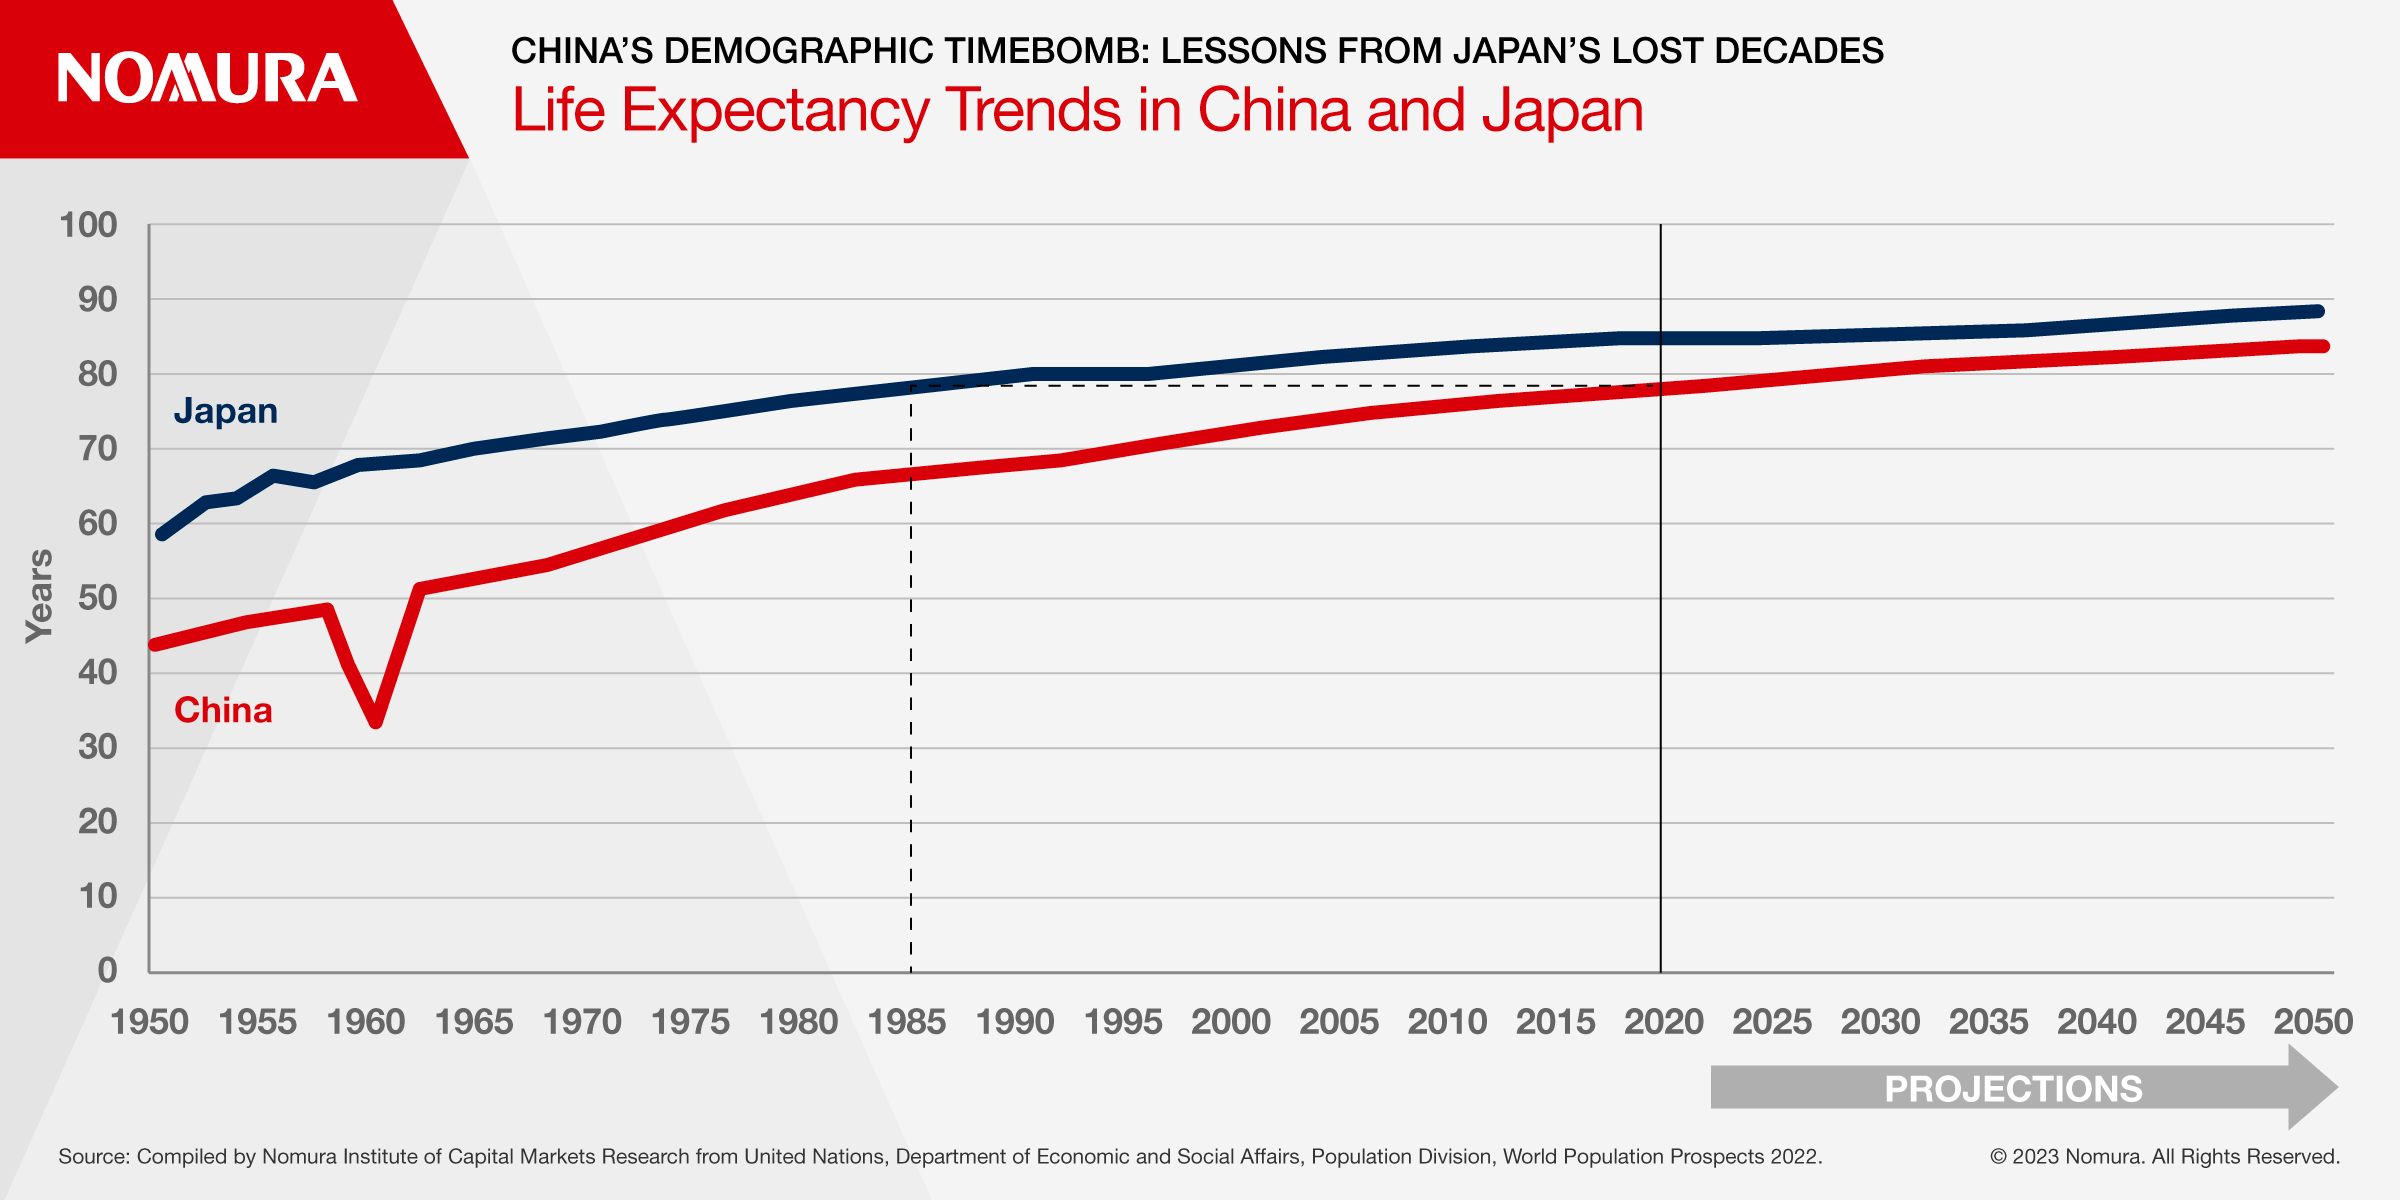
One factor behind the aging of the population is the increase in life expectancy. From 1980 to 2020, life expectancy in Japan and China increased from 76.1 to 84.7 years and from 64.4 to 78.1 years, respectively. The UN predicts that China’s life expectancy will rise to 83.8 years in 2050, approaching the level of Japan (88.3 years) (Figure 3).
Figure 3: Life Expectancy Trends in China and Japan
Measures to Sustain Growth
Japan experienced a period of rapid growth after the end of World War II, but growth has been declining since the first oil shock in 1973, and the same trend has been observed in China since the beginning of the 2010s. A falling birthrate and aging population are holding back growth through a shrinking labor force and lower savings rates (and thus investment rates). To sustain economic growth, in addition to the birthrate and the labor participation rate, productivity must also be raised.
Japan has tried to boost its labor force by encouraging childbearing, promoting women’s employment and raising the retirement age. Among these factors, promoting childbirth has not stopped the decline in the fertility rate, but promoting women’s employment and extending the retirement age have had a certain effect. In China, on the other hand, women’s participation in the labor force is already high (however, the legal retirement age is low) and there is limited room for further increases, so easing birth restrictions and raising the retirement age are key to resolving labor shortages.
China has gradually eased its one-child policy in recent years. The most recent change came in 2021 when the Politburo of the Chinese Communist Party approved a policy to allow couples to have up to 3 children. Despite this, China’s fertility rate has not recovered. Given the severity of the problem, all birth restrictions will eventually have to be abolished.
China has included an increase in the legal retirement age as a policy in its 14th Five-Year Plan (2021 to 2025). The current legal retirement age is 60 for men, 55 for women executives and 50 for women workers. This was determined in the early years following the founding of the People’s Republic of China in 1949, based on various factors such as life expectancy, working conditions, and employment practices. However, as the working-age population has been decreasing while life expectancy has been increasing, the shortage of funds for pension benefits has become more serious. Along with extending the retirement age, the pension premium payment period is expected to be extended while the age at which pension benefits begin to accrue is expected to be raised. This will improve the balance of pension finance.
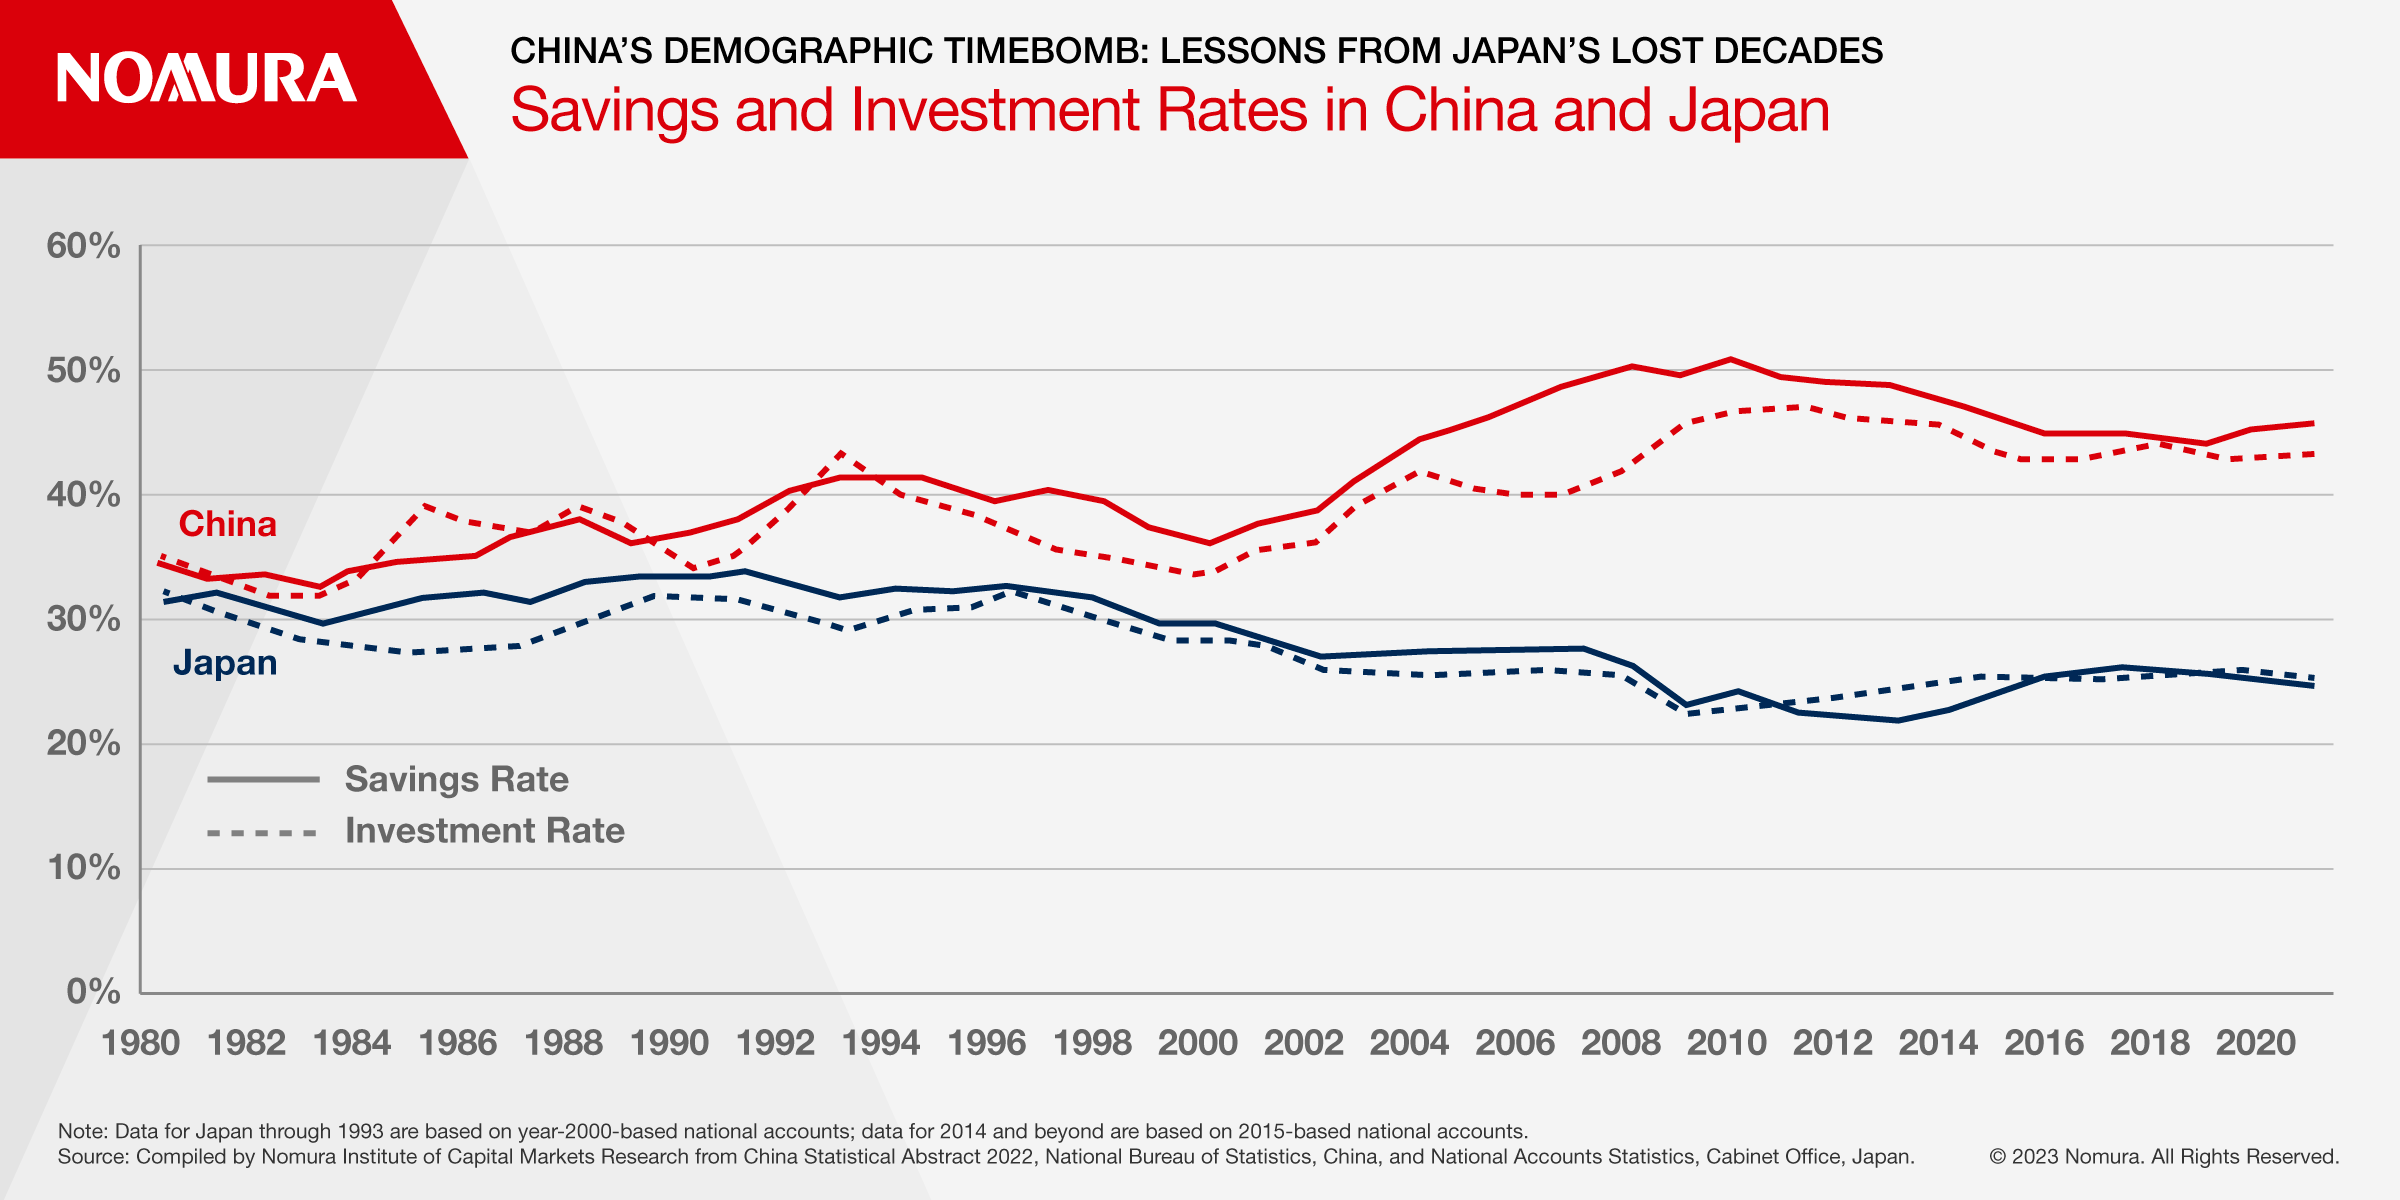
Against the backdrop of an aging population, the savings rate (the ratio of savings to GDP) in Japan and China peaked at 34.1% in 1991 and 50.7% in 2010, respectively, before declining to 24.6% and 45.7% in 2021 (Figure 4). Reflecting the fact that the majority of investment is funded by domestic savings, the investment rate (the ratio of capital formation to GDP) in both countries has declined in tandem with the savings rate. The slowdown in investment means stagnating capital accumulation, which, along with a shrinking labor force, reduces the potential growth rates of both countries. As a countermeasure, it is necessary to increase productivity through the acceleration of innovation and industrial upgrading.
Figure 4: Savings and Investment Rates in China and Japan
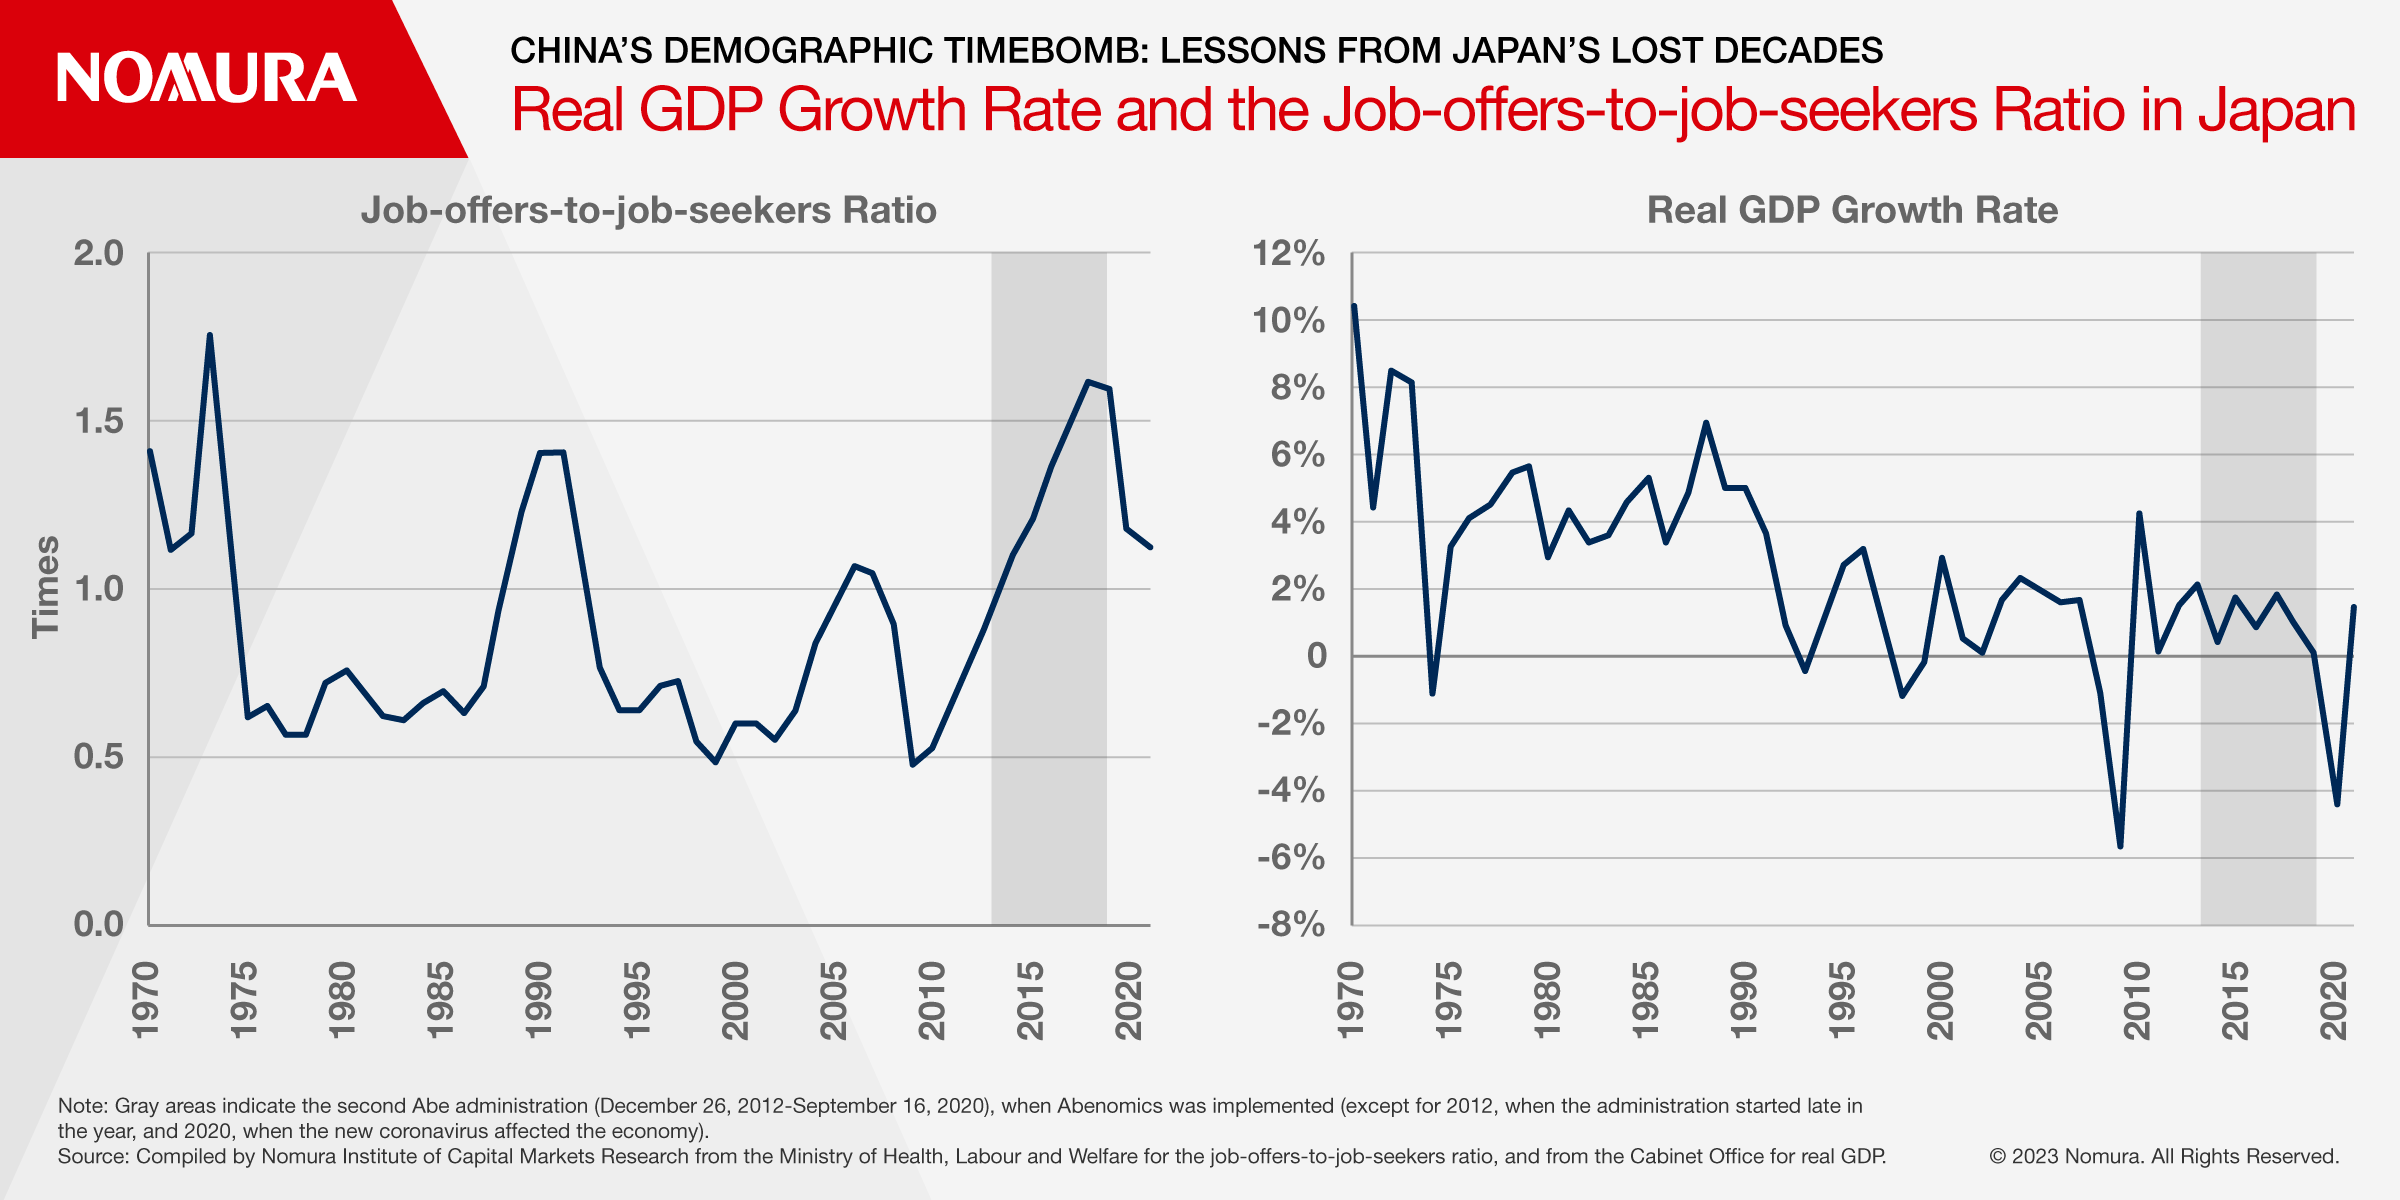
In Japan’s case, however, the economic downturn has been prolonged as structural reforms failed. For example, Abenomics, with its “three arrows” policy, achieved full employment as shown by the job-offers-to-seekers ratio briefly exceeding that of the bubble period of the late 1980s, thanks to the success of the first arrow, “bold monetary policy,” and the second arrow, “flexible fiscal policy.” On the other hand, the side effects are significant, with an aggressive fiscal policy leading to huge government debt and the persistence of a low interest rate policy preserving many “zombie companies” that should have been weeded out. Furthermore, the third arrow, a “growth strategy to stimulate private investment,” ended in failure, and the implementation of Abenomics did not boost the potential growth rate (Figure 5).
Figure 5: Real GDP Growth Rate and the Job-offers-to-job-seekers Ratio in Japan
Japan’s experience suggests that demand stimulus measures, particularly expansionary fiscal and monetary policies, have at best a temporary effect and that supply-side reforms are essential to sustain growth. To avoid making Japan’s mistake, China must further reform and open up while capitalizing on the vitality of its private enterprises. However, with the government’s industrial policy focusing on strengthening state-owned enterprises and indigenous innovation against a backdrop of a return to public ownership domestically and the decoupling of the U.S. and Chinese economies in external relations, the road to economic recovery is expected to be difficult.
Nomura Institute of Capital Markets Research Senior Fellow
Disclaimer
This content has been prepared by Nomura solely for information purposes, and is not an offer to buy or sell or provide (as the case may be) or a solicitation of an offer to buy or sell or enter into any agreement with respect to any security, product, service (including but not limited to investment advisory services) or investment. The opinions expressed in the content do not constitute investment advice and independent advice should be sought where appropriate.The content contains general information only and does not take into account the individual objectives, financial situation or needs of a person. All information, opinions and estimates expressed in the content are current as of the date of publication, are subject to change without notice, and may become outdated over time. To the extent that any materials or investment services on or referred to in the content are construed to be regulated activities under the local laws of any jurisdiction and are made available to persons resident in such jurisdiction, they shall only be made available through appropriately licenced Nomura entities in that jurisdiction or otherwise through Nomura entities that are exempt from applicable licensing and regulatory requirements in that jurisdiction. For more information please go to https://www.nomuraholdings.com/policy/terms.html.